 Old boat
Liquidia $LQDA
Grew revenue 1031% in FY2025 to $158 million, operating margin -32.5% against a -3.8% median for pharmaceutical preparations, equity 13.6% of assets.
Last filing8-K · Item 5.02 Departure or Election of Directors; Appointment of Officers, 18 Nov 2026
Edgarette’s full reading · exposure, experience, soundness, credibility, range
🫧 Edgar looked up LIQUIDIA CORPORATION ($LQDA). Last filing: 8-K (5.02 Departure or Election of Directors; Appointment of Officers), 2026-11-18. 11 event filings (8-K) in the past twelve months.
🔖 Exposure: revenue $158.3M (FY2025). Experience: revenue up 1031.2% on the year, up 87.3% a year over 4 years; operating margin -32.5%, up from -866.6%. Soundness: equity 13.6% of assets, return on equity -154.0%. Credibility: four or more audited years, reasonable weight. Range: 80% of past cases like this landed between $801.1M and $1.4B next year (method v4.1: its own 3-year record of growth weighed at 40% against $100M–1B filers; across 2019–2025, 69.0% landed inside, 83.4% on the one year the method never saw). In a shock year the stress range is $699.6M to $1.6B. A statistical range, not company guidance. Against peers (114 filers, $50M+ revenue, pharmaceutical preparations): operating margin -32.5% against a -3.8% median; growth 1031.2% against 13.7%.
Read from its own SEC filings · nothing written, nothing inferred
Speed and cash · fiscal 2025
Both views must agree for a label · a description, not advice.
| Cash flow (op · inv · fin · free) | −$36M · −$6M · $60M · −$40M |
| Investment book (cash · short · long) | $191M · — · — · current ratio 2.01 |
| Revenue swing · equity of assets | 22.6% · 13.7% |
Liquidia is growing faster than its size class, with revenue that swings more. Its own audited SEC figures.
The figures, as filed
| Fiscal year end | 2025-12-31 |
| Revenue | $158M |
| Revenue, on the year | 1031.2% |
| Revenue, a year over the record | 87.3% |
| Operating margin | −32.5% |
| Operating margin, prior year | −866.6% |
| Net margin | −43.5% |
| Research and development | $39M · 24.8% of revenue |
| Total debt | — |
| Equity of assets | 13.6% |
| Return on equity | −154.0% |
| Payout of profit | — |
| Dividend per share | — |
| Earnings per share | $-0.8 |
| Book value per share | $0.52 |
| Revenue per share | $1.84 |
| Shares outstanding | 86,059,101 |
| Audited years read | 5 |
Peers: the median of 114 filers with $50M+ revenue in pharmaceutical preparations.
Classic signals · fiscal 2025Altman Z″ -4.36 distress zone 1968Piotroski F 4 of 9 middling 2000Beneish M not enough filed detail (needs receivables, cost of revenue, PP&E, depreciation, SG&A for two years)Sloan accruals -11.9% earnings backed by cash 1996DuPont ROE -111.1% = margin -43.5% × turns 0.57 × leverage 4.5
What a terminal subscription used to buy, a filing and arithmetic now give anyone. Published method, from the same filings. Display only: nothing here moves the range or its receipt. Why? →
Health HarborLiquidia sails as Old boat3 warning signs
Health watch · 12 monthsDirector or officer change
Versus peersoperating margin −32.5% vs a −3.8% median · revenue growth 1031.2% vs 13.7% · cash beats 8% of its size class · growth beats 97% 114 pharmaceutical preparations filers
Trend · last year to this▲operating margin −866.6% → −32.5% · ▲revenue $14.0M → $158.3M · 5-year revenue: $12.9M · $15.9M · $17.5M · $14.0M · $158.3M
See all 221 pharmaceutical preparations companies on POPS4 sorted from the newest ship to the boat at the dock
| # | Company | Condition | Operating margin | Revenue growth | Sales | |
|---|---|---|---|---|---|---|
| 1 | 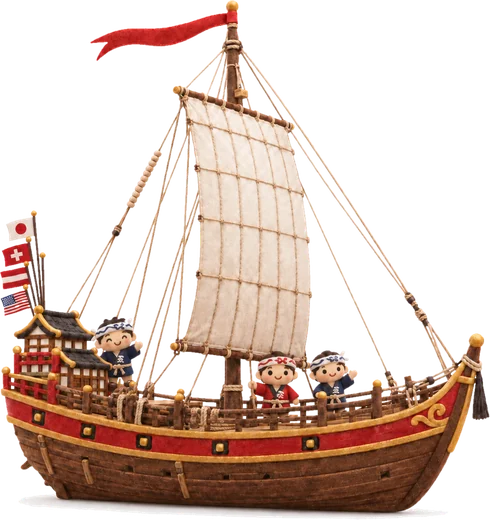 | United TherapeuticsUTHR | New ship | 46.9% | 10.6% | $3.2B |
| 2 | | Vertex Pharmaceuticals Inc / MAVRTX | New ship | 34.8% | 8.9% | $12.0B |
| 3 | | Keros TherapeuticsKROS | New ship | 27.7% | 6775.0% | $244.1M |
| 4 | | Regeneron PharmaceuticalsREGN | New ship | 24.9% | 1.0% | $14.3B |
| 5 | | Harmony Biosciences Holdings, Inc.HRMY | New ship | 24.0% | 21.5% | $868.5M |
| 6 | | Abbott LaboratoriesABT | New ship | 18.2% | 5.7% | $44.3B |
| 7 | | Alnylam PharmaceuticalsALNY | New ship | 13.5% | 65.2% | $3.7B |
| 8 | | Phibro Animal HealthPAHC | New ship | 12.8% | 17.1% | $1.5B |
| 9 | | BioMarin PharmaceuticalBMRN | New ship | 12.7% | 12.9% | $3.2B |
| 10 | | Teva Pharmaceutical Industries LimitedTEVA | New ship | 12.5% | 4.3% | $17.3B |
| 11 | | Kiniksa Pharmaceuticals InternationalKNSA | New ship | 11.4% | 60.1% | $677.6M |
| 12 | | HarrowHROW | New ship | 11.2% | 36.4% | $272.3M |
| 13 | | Acadia PharmaceuticalsACAD | New ship | 9.8% | 11.9% | $1.1B |
| 14 | | Corcept TherapeuticsCORT | New ship | 5.9% | 12.8% | $761.4M |
| 15 | | LifevantageLFVN | New ship | 3.3% | −20.1% | $182.6M |
| 16 | | ZoetisZTS | New ship | — | 2.3% | $9.5B |
| 17 | 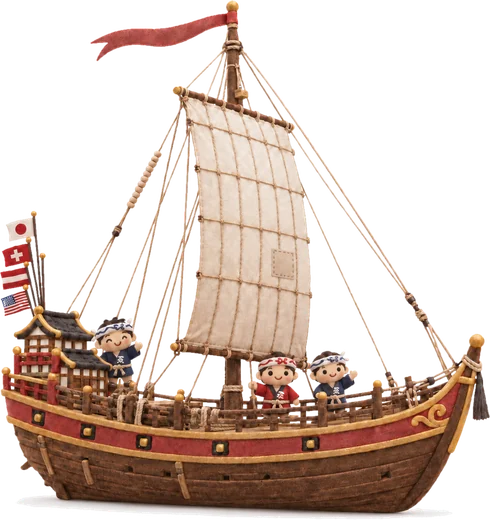 | CormedixCRMD | Sound ship | 48.2% | 617.0% | $311.7M |
| 18 | | Atea PharmaceuticalsAVIR | Sound ship | 39.4% | 622.5% | $351.4M |
| 19 | | Elite PharmaceuticalsELTP | Sound ship | 33.0% | 77.1% | $148.9M |
| 20 | | AbbVieABBV | Sound ship | 24.6% | 8.6% | $61.2B |
| 21 | | Alkermes plc.ALKS | Sound ship | 17.2% | −5.2% | $1.5B |
| 22 | | Ani PharmaceuticalsANIP | Sound ship | 12.6% | 43.8% | $883.4M |
| 23 | | Gyre TherapeuticsGYRE | Sound ship | 9.9% | 10.2% | $116.6M |
| 24 | | Xeris Biopharma HoldingsXERS | Sound ship | 8.5% | 43.7% | $291.8M |
| 25 | | Pacira Biosciences, Inc.PCRX | Sound ship | 2.6% | 3.6% | $726.4M |
| 26 | | Supernus Pharmaceuticals, Inc.1356576 | Sound ship | −8.7% | 8.6% | $719.0M |
| 27 | | Jazz PharmaceuticalsJAZZ | Sound ship | −10.1% | 4.9% | $4.3B |
| 28 | | Nomad Power SolutionsNMAD | Sound ship | −1323.2% | — | $0.2M |
| 29 | | Sagimet BiosciencesSGMT | Sound ship | −1537.0% | — | $2.0M |
| 30 | | Larimar TherapeuticsLRMR | Sound ship | — | — | $0.0M |
| 31 | | TuHURA Biosciences, Inc./NVHURA | Sound ship | — | — | $0.0M |
| 32 | | Phio PharmaceuticalsPHIO | Sound ship | — | −100.0% | $0.0M |
| 33 | | Processa PharmaceuticalsPCSA | Sound ship | — | — | $0.0M |
| 34 | | Edesa BiotechEDSA | Sound ship | — | −100.0% | $0.0M |
| 35 | | Summit TherapeuticsSMMT | Sound ship | — | — | $0.0M |
| 36 | | Decoy TherapeuticsDCOY | Sound ship | — | −100.0% | $0.0M |
| 37 | | XbiotechXBIT | Sound ship | — | −100.0% | $0.0M |
| 38 | | ImmuneeringIMRX | Sound ship | — | −100.0% | $0.0M |
| 39 | | Alx Oncology HoldingsALXO | Sound ship | — | — | $0.0M |
| 40 | | Gri BioGRI | Sound ship | — | −100.0% | $0.0M |
| 41 | | Merck & Co.MRK | Sound ship | — | 1.3% | $65.0B |
| 42 | | Aethlon MedicalAEMD | Sound ship | — | −100.0% | $0.0M |
| 43 | | Theriva Biologics, Inc.TOVX | Sound ship | — | −100.0% | $0.0M |
| 44 | 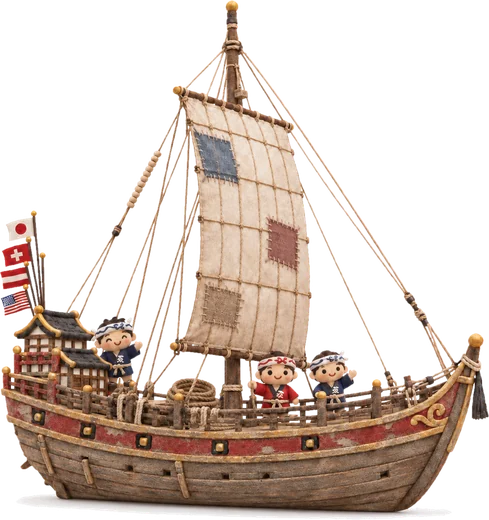 | Filana TherapeuticsFLNA | Weathered boat | 76.3% | 277.6% | $41.1M |
| 45 | | Ptc Therapeutics, Inc.PTCT | Weathered boat | 50.1% | 114.5% | $1.7B |
| 46 | | Bio EssenceBIOE | Weathered boat | 47.4% | 485.8% | $1.9M |
| 47 | | Ironwood PharmaceuticalsIRWD | Weathered boat | 33.3% | −15.7% | $296.2M |
| 48 | | Indivior PharmaceuticalsSUPN | Weathered boat | 21.1% | 4.3% | $1.2B |
| 49 | | Akebia TherapeuticsAKBA | Weathered boat | 9.9% | 47.5% | $236.2M |
| 50 | | Spero TherapeuticsSPRO | Weathered boat | 9.5% | 39.2% | $66.8M |
| 51 | | Eton PharmaceuticalsETON | Weathered boat | −1.1% | 104.9% | $80.0M |
| 52 | | Heron Therapeutics, Inc. /DE/HRTX | Weathered boat | −1.6% | 7.4% | $154.9M |
| 53 | | Mirum PharmaceuticalsMIRM | Weathered boat | −4.2% | 54.7% | $521.3M |
| 54 | | Integrated BiopharmaINBP | Weathered boat | −6.2% | −19.3% | $43.9M |
| 55 | | Cumberland PharmaceuticalsCPIX | Weathered boat | −6.3% | 17.6% | $44.5M |
| 56 | | Stoke TherapeuticsSTOK | Weathered boat | −11.2% | 404.5% | $184.4M |
| 57 | | Travere TherapeuticsTVTX | Weathered boat | −12.8% | 110.5% | $490.7M |
| 58 | | ViatrisVTRS | Weathered boat | −18.6% | −3.0% | $14.3B |
| 59 | | Sarepta TherapeuticsSRPT | Weathered boat | −31.8% | 15.6% | $2.2B |
| 60 | | Zai Lab LimitedZLAB | Weathered boat | −49.9% | 15.3% | $460.2M |
| 61 | | Syndax PharmaceuticalsSNDX | Weathered boat | −158.4% | 627.8% | $172.4M |
| 62 | | InsmedINSM | Weathered boat | −205.6% | 66.7% | $606.4M |
| 63 | | Cocrystal PharmaCOCP | Weathered boat | −476.0% | −69.3% | $2.0M |
| 64 | | Relmada TherapeuticsRLMD | Weathered boat | −877.7% | −35.4% | $0.0M |
| 65 | | Aptevo TherapeuticsAPVO | Weathered boat | −919.7% | −74.7% | $3.1M |
| 66 | | Elicio TherapeuticsELTX | Weathered boat | −1031.4% | −91.9% | $2.3M |
| 67 | | Cogent BiosciencesCOGT | Weathered boat | −1044.3% | −65.0% | $7.9M |
| 68 | | Neuphoria TherapeuticsNEUP | Weathered boat | −1401.1% | −92.5% | $1.2M |
| 69 | | Matinas Biopharma HoldingsMTNB | Weathered boat | −2168.4% | −65.6% | $1.1M |
| 70 | | Pasithea TherapeuticsKTTA | Weathered boat | −2587.3% | 3130.4% | $0.5M |
| 71 | | Ernexa TherapeuticsERNA | Weathered boat | −2693.1% | 755.9% | $0.6M |
| 72 | | Perspective TherapeuticsCATX | Weathered boat | −2855.0% | — | $1.4M |
| 73 | | Unicycive TherapeuticsUNCY | Weathered boat | −3077.6% | −29.0% | $0.7M |
| 74 | | Allarity TherapeuticsALLR | Weathered boat | −3939.1% | — | $0.3M |
| 75 | | ImunonIMNN | Weathered boat | −4984.3% | 0.0% | $0.5M |
| 76 | | Soligenix, Inc.SNGX | Weathered boat | −7907.7% | −85.8% | $0.1M |
| 77 | | Seres TherapeuticsMCRB | Weathered boat | −11910.1% | — | $0.8M |
| 78 | | Tempest TherapeuticsTPST | Weathered boat | −28585.1% | −54.8% | $0.3M |
| 79 | | Gain Therapeutics, IncGANX | Weathered boat | −40328.3% | −60.6% | $0.1M |
| 80 | | OragenicsOGEN | Weathered boat | −55519.9% | −71.4% | $0.0M |
| 81 | | Atossa TherapeuticsATOS | Weathered boat | −725746.2% | −95.6% | $0.0M |
| 82 | | Inhibitor TherapeuticsINTI | Weathered boat | — | — | $0.0M |
| 83 | | GT BiopharmaGTBP | Weathered boat | — | — | $0.0M |
| 84 | | CytodynCYDY | Weathered boat | — | −100.0% | $0.0M |
| 85 | | Rocket PharmaceuticalsRCKT | Weathered boat | — | — | $0.0M |
| 86 | | Kiora PharmaceuticalsKPRX | Weathered boat | — | −100.0% | $0.0M |
| 87 | | Nanoviricides, Inc.NNVC | Weathered boat | — | — | $0.0M |
| 88 | | Rein TherapeuticsRNTX | Weathered boat | — | — | $0.0M |
| 89 | | Annovis BioANVS | Weathered boat | — | — | $0.0M |
| 90 | | Earth Science TechETST | Weathered boat | — | 7.8% | $35.7M |
| 91 | | Hepion PharmaceuticalsHEPA | Weathered boat | — | — | $0.0M |
| 92 | | Viking TherapeuticsVKTX | Weathered boat | — | — | $0.0M |
| 93 | | Spyre TherapeuticsSYRE | Weathered boat | — | — | $0.0M |
| 94 | | vTv TherapeuticsVTVT | Weathered boat | — | −100.0% | $0.0M |
| 95 | | Amylyx PharmaceuticalsAMLX | Weathered boat | — | −100.0% | $0.0M |
| 96 | | Moleculin BiotechMBRX | Weathered boat | — | — | $0.0M |
| 97 | | AzitraAZTR | Weathered boat | — | −100.0% | $0.0M |
| 98 | | Aardvark TherapeuticsAARD | Weathered boat | — | — | $0.0M |
| 99 | | Benitec BiopharmaBNTC | Weathered boat | — | −100.0% | $0.0M |
| 100 | | Barinthus Biotherapeutics1828185 | Weathered boat | — | −100.0% | $0.0M |
| 101 | | Pmgc HoldingsELAB | Weathered boat | — | −65.5% | $0.6M |
| 102 | | Incannex HealthcareIXHL | Weathered boat | — | −100.0% | $0.0M |
| 103 | | PfizerPFE | Weathered boat | — | −1.6% | $62.6B |
| 104 | 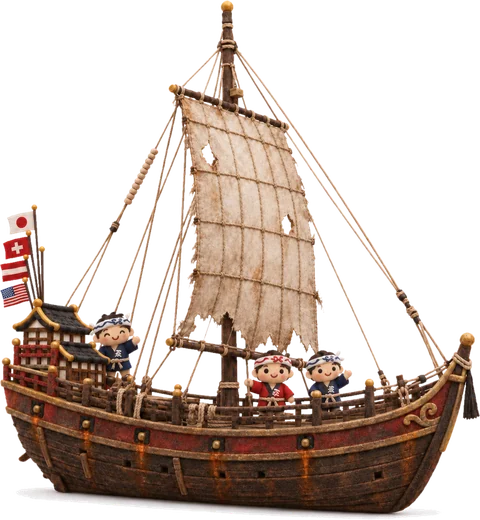 | Evofem BiosciencesEVFM | Old boat | 16.7% | 4.2% | $20.2M |
| 105 | | Emergent BiosolutionsEBS | Old boat | 13.5% | −28.8% | $742.9M |
| 106 | | Lftd PartnersLIFD | Old boat | 2.5% | −1.1% | $36.9M |
| 107 | | Arcutis BiotherapeuticsARQT | Old boat | −3.3% | 91.3% | $376.1M |
| 108 | | Theravance Biopharma1583107 | Old boat | −3.4% | 66.9% | $107.5M |
| 109 | | Rockwell Medical, Inc.RMTI | Old boat | −6.8% | −31.8% | $69.3M |
| 110 | | Lifecore BiomedicalLFCR | Old boat | −13.4% | 0.5% | $128.9M |
| 111 | | LiquidiaLQDA · this company | Old boat | −32.5% | 1031.2% | $158.3M |
| 112 | | Ionis PharmaceuticalsIONS | Old boat | −40.4% | 33.8% | $943.7M |
| 113 | | ScynexisSCYX | Old boat | −78.0% | 449.9% | $20.6M |
| 114 | | China Pharma HoldingsCPHI | Old boat | −78.2% | −8.5% | $4.1M |
| 115 | | ZymeworksZYME | Old boat | −87.3% | 38.9% | $106.0M |
| 116 | | Xenetic BiosciencesXBIO | Old boat | −95.2% | 19.0% | $3.0M |
| 117 | | Standard BiotoolsLAB | Old boat | −129.2% | −6.2% | $85.3M |
| 118 | | Enanta PharmaceuticalsENTA | Old boat | −130.7% | −3.4% | $65.3M |
| 119 | | Arrowhead PharmaceuticalsARWR | Old boat | −156.9% | −45.6% | $450.8M |
| 120 | | NextCureNXTC | Old boat | −184.2% | 252.6% | $22.4M |
| 121 | | Ensysce BiosciencesENSC | Old boat | −202.1% | −2.8% | $5.1M |
| 122 | | OmerosOMER | Old boat | −212.6% | −34.0% | $73.8M |
| 123 | | VeruVERU | Old boat | −214.2% | 3.6% | $16.9M |
| 124 | | Korsana BiosciencesKRSA | Old boat | −239.8% | 3.7% | $2.1M |
| 125 | | Coya TherapeuticsCOYA | Old boat | −283.9% | 123.6% | $7.9M |
| 126 | | CerenomeCNSY | Old boat | −293.5% | −10.5% | $5.2M |
| 127 | | Kura OncologyKURA | Old boat | −449.9% | 25.2% | $67.5M |
| 128 | | Bolt BiotherapeuticsBOLT | Old boat | −469.3% | 0.1% | $7.7M |
| 129 | | Wave Life SciencesWVE | Old boat | −504.1% | −60.5% | $42.7M |
| 130 | | LipocineLPCN | Old boat | −524.7% | −82.3% | $2.0M |
| 131 | | VerastemVSTM | Old boat | −550.3% | 209.1% | $30.9M |
| 132 | | Valion BioVBIO | Old boat | −573.8% | −33.7% | $0.8M |
| 133 | | Igc PharmaIGC | Old boat | −585.8% | −5.5% | $1.3M |
| 134 | | Pyxis OncologyPYXS | Old boat | −609.2% | −14.2% | $13.9M |
| 135 | | EvommuneEVMN | Old boat | −623.6% | 85.7% | $13.0M |
| 136 | | 60 Degrees PharmaceuticalsSXTP | Old boat | −771.6% | 65.5% | $1.0M |
| 137 | | Prelude TherapeuticsPRLD | Old boat | −861.3% | 73.4% | $12.1M |
| 138 | | Dare BioscienceDARE | Old boat | −1315.5% | 10429.4% | $1.0M |
| 139 | | Abeona TherapeuticsABEO | Old boat | −1536.9% | 66.3% | $5.8M |
| 140 | | Nexentis TechnologiesNXTS | Old boat | −1563.3% | −20.3% | $0.2M |
| 141 | | Lexaria BioscienceLEXX | Old boat | −1683.0% | 52.0% | $0.7M |
| 142 | | OnconetixONCO | Old boat | −2190.0% | −67.7% | $0.8M |
| 143 | | Regenerex Pharma1357878 | Old boat | −2445.7% | −31.9% | $0.0M |
| 144 | | ImmunomeIMNM | Old boat | −3228.8% | −23.2% | $6.9M |
| 145 | | MedicinovaMNOV | Old boat | −3242.5% | −59.0% | $0.4M |
| 146 | | Vyome HoldingsHIND | Old boat | −3269.4% | −96.0% | $0.3M |
| 147 | | Rafael HoldingsRFL | Old boat | −3822.5% | −4.7% | $0.9M |
| 148 | | RallybioRLYB | Old boat | −3853.6% | 34.9% | $0.9M |
| 149 | | Yarrow BioscienceYARW | Old boat | −5219.1% | 13.8% | $0.6M |
| 150 | | Silo PharmaSILO | Old boat | −5937.0% | 0.0% | $0.1M |
| 151 | | Scienture HoldingsSCNX | Old boat | −9867.9% | 215.9% | $0.4M |
| 152 | | Impact BioMedicalIBO | Old boat | −13381.3% | −36.0% | $0.0M |
| 153 | | AtaiBeckley2081043 | Old boat | −15751.1% | 1227.6% | $4.1M |
| 154 | | Silence TherapeuticsSLN | Old boat | −16292.8% | −98.7% | $0.6M |
| 155 | | iBio, Inc.IBIO | Old boat | −35141.0% | −75.0% | $0.1M |
| 156 | | Actinium PharmaceuticalsATNM | Old boat | −40274.4% | 11.1% | $0.1M |
| 157 | | Alaunos TherapeuticsTCRT | Old boat | −84500.0% | −50.0% | $0.0M |
| 158 | | Connect Biopharma Holdings LimitedCNTB | Old boat | −90740.6% | −99.8% | $0.1M |
| 159 | | Avalo TherapeuticsAVTX | Old boat | −123601.7% | −86.6% | $0.1M |
| 160 | | Inovio PharmaceuticalsINO | Old boat | −132871.3% | −70.0% | $0.1M |
| 161 | | Altimmune, Inc.ALT | Old boat | −230461.0% | 105.0% | $0.0M |
| 162 | | Protagenic Therapeutics, Inc.\newPTIX | Old boat | — | — | $0.0M |
| 163 | | Kala BioKALA | Old boat | — | — | $0.0M |
| 164 | | BeyondSpringBYSI | Old boat | — | — | $0.0M |
| 165 | | ExicureXCUR | Old boat | — | −100.0% | $0.0M |
| 166 | | Inmed PharmaceuticalsMTRI | Old boat | — | 7.5% | $4.9M |
| 167 |  | Vireo GrowthVREOF | Rotting at the dock | −0.4% | 170.4% | $268.8M |
| 168 | | International Stem CellISCO | Rotting at the dock | −2.9% | 0.2% | $9.1M |
| 169 | | Aytu BiopharmaAYTU | Rotting at the dock | −14.4% | −13.3% | $57.6M |
| 170 | | Sunshine BiopharmaSBFM | Rotting at the dock | −17.2% | 4.1% | $36.3M |
| 171 | | Opko HealthOPK | Rotting at the dock | −19.3% | −14.9% | $606.9M |
| 172 | | Body And Mind1715611 | Rotting at the dock | −33.6% | −2.4% | $22.8M |
| 173 | | MacrogenicsMGNX | Rotting at the dock | −48.7% | −0.3% | $149.5M |
| 174 | | Karyopharm TherapeuticsKPTIQ | Rotting at the dock | −62.1% | 0.6% | $146.1M |
| 175 | | Acura Pharmaceuticals786947 | Rotting at the dock | −77.7% | −56.2% | $1.6M |
| 176 | | Ultragenyx PharmaceuticalRARE | Rotting at the dock | −79.5% | 20.2% | $673.0M |
| 177 | | Petros Pharmaceuticals, Inc.PTPI | Rotting at the dock | −90.5% | −12.2% | $5.1M |
| 178 | | Arcturus Therapeutics HoldingsARCT | Rotting at the dock | −93.0% | −46.1% | $82.0M |
| 179 | | Regen BiopharmaRGBP | Rotting at the dock | −143.1% | 0.0% | $0.2M |
| 180 | | Adc Therapeutics SAADCT | Rotting at the dock | −149.3% | 14.9% | $81.4M |
| 181 | | Aquestive TherapeuticsAQST | Rotting at the dock | −159.5% | −22.6% | $44.5M |
| 182 | | CelularityCELU | Rotting at the dock | −230.9% | −51.0% | $26.6M |
| 183 | | Nektar TherapeuticsNKTR | Rotting at the dock | −253.7% | −43.9% | $55.2M |
| 184 | | Opus GeneticsIRD | Rotting at the dock | −271.9% | 29.1% | $14.2M |
| 185 | | Foghorn TherapeuticsFHTX | Rotting at the dock | −279.5% | 36.8% | $30.9M |
| 186 | | Gossamer BioGOSS | Rotting at the dock | −352.2% | −57.7% | $48.5M |
| 187 | | Jaguar HealthJAGX | Rotting at the dock | −398.8% | −1.5% | $11.5M |
| 188 | | Ocular TherapeutixOCUL | Rotting at the dock | −519.8% | −18.5% | $52.0M |
| 189 | | Traws Pharma, Inc.TRAW | Rotting at the dock | −640.7% | 1134.5% | $2.8M |
| 190 | | Cytokinetics, IncorporatedCYTK | Rotting at the dock | −695.4% | 376.6% | $88.0M |
| 191 | | CervoMedCRVO | Rotting at the dock | −706.2% | −58.9% | $4.0M |
| 192 | | Kyntra BioKYNB | Rotting at the dock | −712.7% | −78.3% | $6.4M |
| 193 | | Oramed PharmaceuticalsORMP | Rotting at the dock | −754.4% | 49.3% | $2.0M |
| 194 | | Geovax LabsGOVX | Rotting at the dock | −869.3% | −37.1% | $2.5M |
| 195 | | Tonix Pharmaceuticals HoldingTNXP | Rotting at the dock | −959.1% | 29.8% | $13.1M |
| 196 | | Aclaris TherapeuticsACRS | Rotting at the dock | −975.9% | −58.2% | $7.8M |
| 197 | | Nrx PharmaceuticalsNRXP | Rotting at the dock | −1122.8% | — | $1.4M |
| 198 | | uniQureQURE | Rotting at the dock | −1151.4% | −40.6% | $16.1M |
| 199 | | Whitehawk TherapeuticsWHWK | Rotting at the dock | −1601.1% | −72.5% | $7.1M |
| 200 | | Polomar Health ServicesPMHS | Rotting at the dock | −1627.5% | 1002.0% | $0.6M |
| 201 | | LongeveronLGVN | Rotting at the dock | −1942.2% | −49.9% | $1.2M |
| 202 | | Prothena Corporation Public Limited CompanyPRTA | Rotting at the dock | −2216.4% | −92.8% | $9.7M |
| 203 | | Abvc BiopharmaABVC | Rotting at the dock | −2416.0% | −41.9% | $0.3M |
| 204 | | Trafalgar InternationalTRFA | Rotting at the dock | −2716.9% | −73.7% | $0.0M |
| 205 | | Quantum CyberQUCY | Rotting at the dock | −3005.0% | −39.9% | $0.5M |
| 206 | | Northwest BiotherapeuticsNWBO | Rotting at the dock | −4347.9% | −0.3% | $1.4M |
| 207 | | Vistagen TherapeuticsVTGN | Rotting at the dock | −5683.7% | 161.1% | $1.3M |
| 208 | | BioAdaptivesBDPT | Rotting at the dock | −5701.8% | 44.3% | $0.0M |
| 209 | | Roivant SciencesROIV | Rotting at the dock | −6235.7% | −71.6% | $8.3M |
| 210 | | Crinetics Pharmaceuticals1658247 | Rotting at the dock | −6714.8% | 640.7% | $7.7M |
| 211 | | BioXcel TherapeuticsBTAIQ | Rotting at the dock | −7860.0% | −71.7% | $0.6M |
| 212 | | Lisata TherapeuticsLSTA | Rotting at the dock | −10711.2% | −83.0% | $0.2M |
| 213 | | CleneCLNN | Rotting at the dock | −11541.5% | −41.5% | $0.2M |
| 214 | | Lunai BioworksLNAI | Rotting at the dock | −16729.4% | — | $0.1M |
| 215 | | Serina TherapeuticsSER | Rotting at the dock | −18478.5% | 132.1% | $0.1M |
| 216 | | Hcw BiologicsHCWB | Rotting at the dock | −24270.7% | −97.9% | $0.1M |
| 217 | | Jupiter NeurosciencesJUNS | Rotting at the dock | −40873.2% | — | $0.0M |
| 218 | | Neonc Technologies HoldingsNTHI | Rotting at the dock | −145637.5% | −51.8% | $0.0M |
| 219 | | Aspire Biopharma HoldingsASBP | Rotting at the dock | −312016.9% | — | $0.0M |
| 220 | | Aditxt1726711 | Rotting at the dock | −612542.2% | −97.6% | $0.0M |
| 221 | | Cnbx PharmaceuticalsCNBX | Rotting at the dock | — | −100.0% | $0.0M |
From each company’s own POPS4 card. Green beats the industry median above, red trails it. Not a rating and not investment advice.
Sailing speed follows growth: 115.0% a year crosses the harbor in 30 seconds.
🌊 Visit the Bay →- Operating cash flow was negative
- Operating loss a margin of -32.5% in FY2025
- Revenue is hard to predict its 80% range is ±26%
Boat condition = number of warning signs: a serious warning filing in 12 months; liabilities over assets; slow and jumpy; negative operating cash; an operating loss; negative free cash flow outside regulated utilities; an 80% revenue range of ±25% or wider. A picture of the signs, not a rating and not investment advice.
Brand success factors · calendar 2025
The Trillion Score: 562
Exponential Success Score
Built on over $200 trillion of sworn revenue, 13 years of data, 770,002 figures. Sealed by Edgarette.
How The Trillion Score works. We read eight measures of success from Liquidia's own SEC filings and test each one against the public companies in its field, here pharmaceutical preparations. The longer and fuller the record, the more weight those results carry. A model built on past filings then turns them into the odds of thriving, which means outgrowing the field for three years without a severe decline. A score of 500 is about average, and every 100 points doubles the odds. Every company is ranked on this same scale.
What it says here. At 562, Liquidia's odds of thriving come to 47%, against about 37% for the typical filer. It meets 4 of 6 success points.
What the score means
The higher the score, the more often companies went on to thrive. At this level, about 44 of every 100 did.
Share of companies that beat their field for three years with no severe decline, tested on 2019 to 2022 filings.
Fall Risk: High
Separate from the score, this asks what could go wrong: the odds of sales falling 30% or the filings stopping within three years. In the tests, about 41 of every 100 companies in the High band did. That is the group's history, not a forecast for this company.
| Money | It burned about 25 cents of free cash on each sales dollar after paying for its plants and equipment. Its cash would cover that burn for about 4.8 years. | cash negative over five years |
| Swings | In its worst fifth of years, sales fell about 100% a year. | -100.0% a year |
| Filed events | In the last two years it told the SEC about 3 filings on leadership or auditor changes. | 3 |
The eight success points
| Point | What it means | Place in field | |
|---|---|---|---|
| Speed | Sales grew faster than most of its field. | 91 of 100 | Met |
| Steadiness | Growth swung a lot for what it delivered. | 39 of 100 | Not yet |
| Price premium | It keeps more of each sales dollar than most of its field. | 63 of 100 | Met |
| Margin stays above the field | Its margin has not held above the field for long. | 55 of 100 | Not yet |
| Moat half-life | Not filed. | ||
| Brand spend yield | Not filed. | ||
| Learning curve | Costs fell as a share of sales as it grew. | 72 of 100 | Met |
| Climb in the field | It has been moving up the size ranks in its field. | 96 of 100 | Met |
The actuarial view
| Credibility | With 7 years of filings, the record earns 50% of the weight. The rest stays at the middle of the field. | 0.50 |
| Severe decline, class B | About 26 of every 100 companies with this many points fell 30% or stopped reporting within three years. | 26.1% |
| Actual vs expected | Sales are 686% higher than if it had simply kept pace with its field. | 7.86 |
Top of its field: #1 Mannkind · #2 Biocryst Pharmaceuticals · #3 Corcept Therapeutics · #4 Kiniksa Pharmaceuticals International · #5 Eli Lilly
Ranked by The Trillion Score. See the method and score your own brand. Tested on 2019 to 2022 filings. Odds, class and Fall Risk figures are the experience of similar filers, not a forecast for this company. A statistical description of past filings, not a rating or advice.
- 8-K · 2026-11-18 · 5.02 Departure or Election of Directors; Appointment of Officers; 9.01 Financial Statements and Exhibits
- 8-K · 2026-11-10 · 2.02 Results of Operations and Financial Condition; 8.01 Other Events; 9.01 Financial Statements and Exhibits
- 10-Q · 2026-11-10
- 8-K · 2026-10-14 · 1.01 Entry into a Material Definitive Agreement; 1.02 Termination of a Material Definitive Agreement; 7.01 Regulation FD Disclosure; 8.01 Other Events; 9.01 Financial Statements and Exhibits
- 8-K · 2026-09-30 · 8.01 Other Events; 9.01 Financial Statements and Exhibits
- 8-K · 2026-09-03 · 8.01 Other Events; 9.01 Financial Statements and Exhibits
Measured, not prophesiedSuccess tools: score it, compare it, see its fieldFour questions. Scored against the SEC filings of the companies in your field.
Each benchmark is the median of SEC filers in your industry code, from their own audited filings, read on the filing boards. Reporting, not investment advice.
Figures are as filed in audited 10-K reports and can move with restatements, acquisitions, disposals or a change in fiscal year. A range set from how past company-years turned out is not a promise about the next one, and says nothing about the share price. Reporting, not investment advice. No price targets and no trading recommendations. Figures from the SEC’s own data · every filing · this page as JSON · Open in Excel (CSV) · Ten-year table (CSV) ·