 Sound ship
West Pharmaceutical Services $WST
Grew revenue 6.3% in FY2025 to $3.1 billion, operating margin 19.0% against a 1.2% median for surgical & medical instruments & apparatus, equity 74.4% of assets, and dividend per share up 14 years running.
Last filing10-Q, 29 Oct 2026
Edgarette’s full reading · exposure, experience, soundness, credibility, range
🫧 Edgar looked up WEST PHARMACEUTICAL SERVICES, INC. ($WST). Last filing: 10-Q, 2026-10-29. 10 event filings (8-K) in the past twelve months.
🔖 Exposure: revenue $3.1B (FY2025), total debt $202.8M. Experience: revenue up 6.3% on the year, up 2.1% a year over 4 years; operating margin 19.0%, down from 19.7%. Soundness: equity 74.4% of assets, return on equity 15.5%, payout 12.4% of profit, dividend per share up 14 years running. Credibility: four or more audited years, reasonable weight. Range: 80% of past cases like this landed between $2.9B and $3.4B next year (method v4.1: its own 4-year record of growth weighed at 50% against $1B–10B filers; across 2019–2025, 69.0% landed inside, 83.4% on the one year the method never saw). In a shock year the stress range is $2.7B to $3.7B. A statistical range, not company guidance. Against peers (60 filers, $50M+ revenue, surgical & medical instruments & apparatus): operating margin 19.0% against a 1.2% median; growth 6.3% against 11.6%.
Read from its own SEC filings · nothing written, nothing inferred
Gold paid out, navy kept. Kept share × return on equity = the growth it can fund itself. Facts from the filings, not a recommendation.
Speed and cash · fiscal 2025
Both views must agree for a label · a description, not advice.
| Cash flow (op · inv · fin · free) | $755M · −$286M · −$185M · $469M |
| Investment book (cash · short · long) | $791M · — · — · current ratio 3.02 |
| Revenue swing · equity of assets | 3.3% · 74.4% |
West Pharmaceutical Services is growing slower than its size class, with steadier revenue. Its own audited SEC figures.
The figures, as filed
| Fiscal year end | 2025-12-31 |
| Revenue | $3.1B |
| Revenue, on the year | 6.3% |
| Revenue, a year over the record | 2.1% |
| Operating margin | 19.0% |
| Operating margin, prior year | 19.7% |
| Net margin | 16.1% |
| Research and development | $74M · 2.4% of revenue |
| Total debt | $203M |
| Equity of assets | 74.4% |
| Return on equity | 15.5% |
| Payout of profit | 12.4% |
| Dividend per share | $0.86 · up 14 years running |
| Earnings per share | $6.83 |
| Book value per share | $43.69 |
| Revenue per share | $42.28 |
| Shares outstanding | 72,700,000 |
| Audited years read | 5 |
Peers: the median of 60 filers with $50M+ revenue in surgical & medical instruments & apparatus.
Classic signals · fiscal 2025Altman Z″ 9.34 safe zone 1968Piotroski F 7 of 9 solid 2000Beneish M -2.79 below the −1.78 line 1999Sloan accruals -6.6% earnings backed by cash 1996DuPont ROE 16.9% = margin 16.1% × turns 0.78 × leverage 1.35
What a terminal subscription used to buy, a filing and arithmetic now give anyone. Published method, from the same filings. Display only: nothing here moves the range or its receipt. Why? →
Health HarborWest Pharmaceutical Services sails as Sound ship1 warning sign
Health watch · 12 monthsCybersecurity incidentDirector or officer change ×2
Versus peersoperating margin 19.0% vs a 1.2% median · revenue growth 6.3% vs 11.6% · cash beats 74% of its size class · growth beats 38% 60 surgical & medical instruments & apparatus filers
Trend · last year to this▼operating margin 19.7% → 19.0% · ▲revenue $2.9B → $3.1B · 5-year revenue: $2.8B · $2.9B · $2.9B · $2.9B · $3.1B
See all 71 surgical & medical instruments & apparatus companies on POPS4 sorted from the newest ship to the boat at the dock
| # | Company | Condition | Operating margin | Revenue growth | Sales | |
|---|---|---|---|---|---|---|
| 1 | 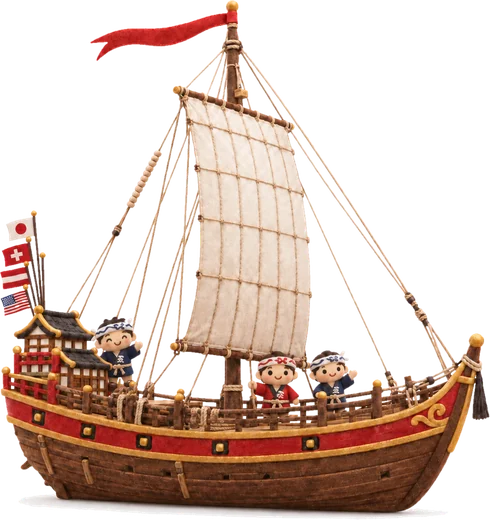 | Lemaitre VascularLMAT | New ship | 27.2% | 13.5% | $249.6M |
| 2 | | DexcomDXCM | New ship | 19.6% | 15.6% | $4.7B |
| 3 | | StrykerSYK | New ship | 19.5% | 11.2% | $25.1B |
| 4 | | MedlineMDLN | New ship | 7.8% | 11.5% | $28.4B |
| 5 | 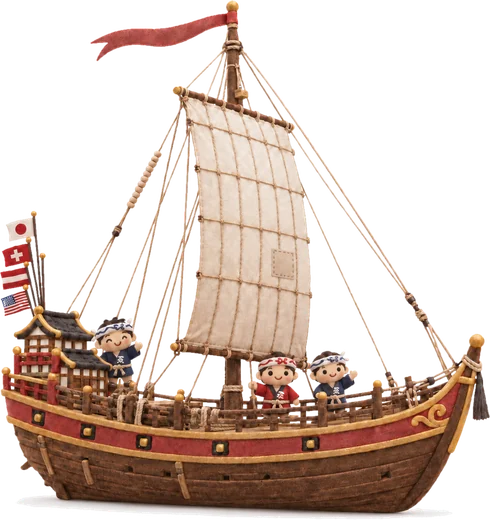 | ResMedRMD | Sound ship | 33.4% | 9.9% | $5.7B |
| 6 | | West Pharmaceutical ServicesWST · this company | Sound ship | 19.0% | 6.3% | $3.1B |
| 7 | | 3M CompanyMMM | Sound ship | 18.6% | 1.5% | $24.9B |
| 8 | | Boston ScientificBSX | Sound ship | 18.0% | 19.9% | $20.1B |
| 9 | | InsuletPODD | Sound ship | 17.5% | 30.7% | $2.7B |
| 10 | | Interpace BiosciencesIDXG | Sound ship | 10.5% | −17.5% | $38.7M |
| 11 | | Infusystem HoldingsINFU | Sound ship | 8.3% | 6.4% | $143.4M |
| 12 | | NephrosNEPH | Sound ship | 6.1% | 32.7% | $18.8M |
| 13 | | AngioDynamicsANGO | Sound ship | −12.5% | 9.5% | $320.2M |
| 14 | | Bluejay DiagnosticsBJDX | Sound ship | −3741.5% | — | $0.2M |
| 15 | | Modular MedicalMODD | Sound ship | — | — | $0.0M |
| 16 | 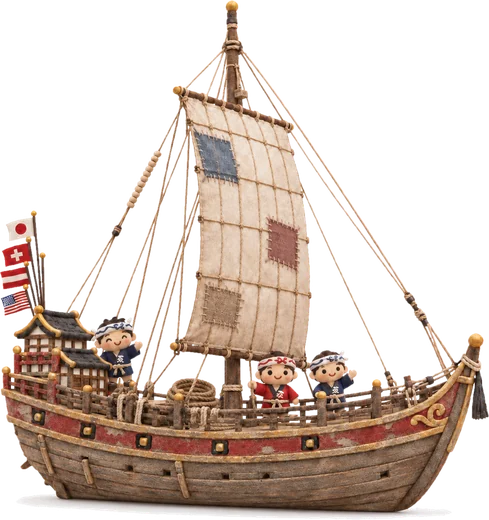 | Microbot MedicalMBOT | Weathered boat | 782.8% | −88.5% | $0.1M |
| 17 | | Pro-DexPDEX | Weathered boat | 16.8% | 16.5% | $77.5M |
| 18 | | Sanuwave HealthSNWV | Weathered boat | 11.2% | 35.0% | $44.1M |
| 19 | | MiniMed GroupMMED | Weathered boat | −6.1% | 14.3% | $3.1B |
| 20 | | iRhythm HoldingsIRTC | Weathered boat | −7.7% | 26.2% | $747.1M |
| 21 | | SI-Bone, Inc.SIBN | Weathered boat | −11.1% | 20.2% | $200.9M |
| 22 | | NovoCure LimitedNVCR | Weathered boat | −23.5% | 8.3% | $655.4M |
| 23 | | Integra Lifesciences HoldingsIART | Weathered boat | −30.2% | 1.5% | $1.6B |
| 24 | | Procept BioRoboticsPRCT | Weathered boat | −33.7% | 37.2% | $308.1M |
| 25 | | Beta BionicsBBNX | Weathered boat | −71.5% | 53.9% | $100.3M |
| 26 | | enVVeno MedicalNVNO | Weathered boat | −24566.5% | −83.3% | $0.0M |
| 27 | | Autonomix MedicalAMIX | Weathered boat | — | — | $0.0M |
| 28 | | Odyssey HealthODYY | Weathered boat | — | — | $0.0M |
| 29 | 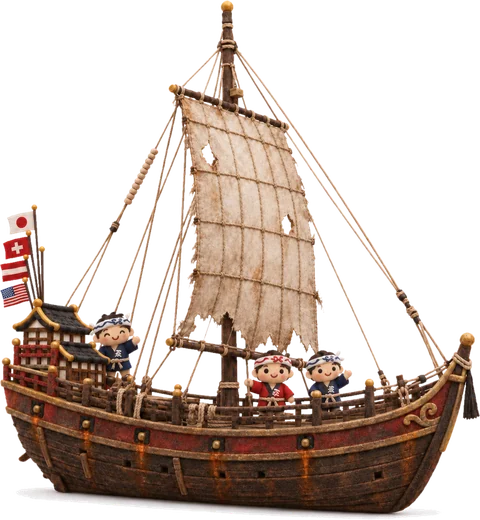 | GlucotrackGCTK | Old boat | 1685.6% | 378.3% | $0.2M |
| 30 | | Teleflex IncorporatedTFX | Old boat | 5.9% | 17.2% | $2.0B |
| 31 | | Accuray IncorporatedARAY | Old boat | −6.6% | −12.3% | $401.9M |
| 32 | | SkinHealth SystemsSKIN | Old boat | −6.9% | −10.0% | $300.8M |
| 33 | | Sonoma PharmaceuticalsSNOA | Old boat | −12.6% | 36.7% | $19.5M |
| 34 | | CarlsmedCARL | Old boat | −60.5% | 85.9% | $50.5M |
| 35 | | CVRxCVRX | Old boat | −90.5% | 10.4% | $56.7M |
| 36 | | Orchestra BioMed HoldingsOBIO | Old boat | −154.7% | 1169.2% | $33.5M |
| 37 | | Profound MedicalPROF | Old boat | −256.3% | 50.7% | $16.1M |
| 38 | | Intelligent Bio SolutionsINBS | Old boat | −299.1% | 38.1% | $4.2M |
| 39 | | Tenon MedicalTNON | Old boat | −324.3% | 20.4% | $3.9M |
| 40 | | Beyond AirXAIR | Old boat | −378.2% | 107.3% | $7.7M |
| 41 | | InspireMDNSPR | Old boat | −552.6% | 28.1% | $9.0M |
| 42 | | FemasysFEMY | Old boat | −767.0% | 40.8% | $2.3M |
| 43 | | Harvard Apparatus Regenerative TechnologyHRGN | Old boat | −982.2% | 63.7% | $0.7M |
| 44 | | SeaStar Medical HoldingICU | Old boat | −986.6% | 814.1% | $1.2M |
| 45 | | Lucid DiagnosticsLUCD | Old boat | −1054.8% | 8.3% | $4.7M |
| 46 | | ProfusaPFSA | Old boat | −4500.0% | — | $0.1M |
| 47 | | VivosRDGL | Old boat | −4628.7% | 144.3% | $0.1M |
| 48 | | CO-DiagnosticsCODX | Old boat | −8058.8% | −84.1% | $0.6M |
| 49 | | Pulse BiosciencesPLSE | Old boat | −21982.6% | — | $0.3M |
| 50 | | PAVmedPAVM | Old boat | −30712.7% | −97.6% | $0.1M |
| 51 | | StimCell EnergeticsSTME | Old boat | — | −100.0% | $0.0M |
| 52 | | Fractyl HealthGUTS | Old boat | — | −100.0% | $0.0M |
| 53 | | Global Innovative PlatformsGIPL | Old boat | — | — | $0.0M |
| 54 | | Adagio Medical Holdings, Inc.ADGM | Old boat | — | −100.0% | $0.0M |
| 55 |  | BiotricityBTCY | Rotting at the dock | 10.6% | 16.0% | $16.0M |
| 56 | | Premier Air Charter HoldingsPREM | Rotting at the dock | −8.5% | 53.6% | $31.9M |
| 57 | | SS Innovations InternationalSSII | Rotting at the dock | −19.3% | 105.7% | $42.5M |
| 58 | | NeuroneticsSTIM | Rotting at the dock | −21.1% | 99.2% | $149.2M |
| 59 | | NexGelNXGL | Rotting at the dock | −29.3% | 31.5% | $11.4M |
| 60 | | CytosorbentsCTSO | Rotting at the dock | −39.8% | 4.1% | $37.1M |
| 61 | | Tela BioTELA | Rotting at the dock | −42.0% | 15.8% | $80.3M |
| 62 | | Spectral AIMDAI | Rotting at the dock | −43.8% | −33.6% | $19.6M |
| 63 | | Nuo TherapeuticsAURX | Rotting at the dock | −76.0% | 142.7% | $3.3M |
| 64 | | Invo FertilityIVF | Rotting at the dock | −105.8% | 4.3% | $6.8M |
| 65 | | Vivos TherapeuticsVVOS | Rotting at the dock | −114.1% | 16.0% | $17.4M |
| 66 | | DarioHealthDRIO | Rotting at the dock | −163.9% | −17.3% | $22.4M |
| 67 | | Picard MedicalPMI | Rotting at the dock | −268.4% | 12.5% | $4.9M |
| 68 | | Osr HealthOSRH | Rotting at the dock | −631.0% | −17.7% | $2.9M |
| 69 | | PetVivo HoldingsPETV | Rotting at the dock | −793.9% | 0.8% | $1.1M |
| 70 | | Sintx TechnologiesSINT | Rotting at the dock | −1053.1% | −64.7% | $1.0M |
| 71 | | Flyte AviationVJET | Rotting at the dock | −2581.6% | 95.0% | $0.8M |
From each company’s own POPS4 card. Green beats the industry median above, red trails it. Not a rating and not investment advice.
Sailing speed follows growth: 2.1% a year crosses the harbor in 74 seconds.
🌊 Visit the Bay →- Filed cybersecurity incident in the last 12 months
Boat condition = number of warning signs: a serious warning filing in 12 months; liabilities over assets; slow and jumpy; negative operating cash; an operating loss; negative free cash flow outside regulated utilities; an 80% revenue range of ±25% or wider. A picture of the signs, not a rating and not investment advice.
Brand success factors · calendar 2025
The Trillion Score: 431
Exponential Success Score
Built on over $200 trillion of sworn revenue, 13 years of data, 770,002 figures. Sealed by Edgarette.
How The Trillion Score works. We read eight measures of success from West Pharmaceutical Services's own SEC filings and test each one against the public companies in its field, here surgical & medical instruments & apparatus. The longer and fuller the record, the more weight those results carry. A model built on past filings then turns them into the odds of thriving, which means outgrowing the field for three years without a severe decline. A score of 500 is about average, and every 100 points doubles the odds. Every company is ranked on this same scale.
What it says here. At 431, West Pharmaceutical Services's odds of thriving come to 26%, against about 37% for the typical filer. It meets 2 of 8 success points.
What the score means
The higher the score, the more often companies went on to thrive. At this level, about 31 of every 100 did.
Share of companies that beat their field for three years with no severe decline, tested on 2019 to 2022 filings.
Fall Risk: Medium
Separate from the score, this asks what could go wrong: the odds of sales falling 30% or the filings stopping within three years. In the tests, about 22 of every 100 companies in the Medium band did. That is the group's history, not a forecast for this company.
| Money | It keeps about 15 cents of free cash from each sales dollar after paying for its plants and equipment. It holds more cash than debt. | low |
| Swings | In its worst fifth of years, sales fell about 2% a year. | -1.9% a year |
| Filed events | In the last two years it told the SEC about 9 filings on leadership or auditor changes. | 9 |
The eight success points
| Point | What it means | Place in field | |
|---|---|---|---|
| Speed | Sales grew slower than much of its field. | 25 of 100 | Not yet |
| Steadiness | Growth swung a lot for what it delivered. | 54 of 100 | Not yet |
| Price premium | It keeps less of each sales dollar than the leaders in its field. | 10 of 100 | Not yet |
| Margin stays above the field | Its margin has not held above the field for long. | 4 of 100 | Not yet |
| Moat half-life | Its margin edge is fading fast, or it has none yet. | 5 of 100 | Not yet |
| Brand spend yield | Brand spending returns more gross profit than for most of its field. | 87 of 100 | Met |
| Learning curve | Costs fell as a share of sales as it grew. | 70 of 100 | Met |
| Climb in the field | It has not been moving up the size ranks in its field. | 19 of 100 | Not yet |
Price premium -$754M is the extra gross profit over a field-median margin. Momentum -$78M is gross profit times growth above the field's pace.
The actuarial view
| Credibility | With 8 years of filings, the record earns 70% of the weight. The rest stays at the middle of the field. | 0.70 |
| Severe decline, class C | About 30 of every 100 companies with this many points fell 30% or stopped reporting within three years. | 30.1% |
| Actual vs expected | Sales are 19% lower than if it had simply kept pace with its field. | 0.81 |
Top of its field: #1 SANUWAVE Health · #2 AVITA Medical · #3 TELA Bio · #4 Inspire Medical Systems · #5 Insulet
Ranked by The Trillion Score. See the method and score your own brand. Tested on 2019 to 2022 filings. Odds, class and Fall Risk figures are the experience of similar filers, not a forecast for this company. A statistical description of past filings, not a rating or advice.
- 10-Q · 2026-10-29
- 8-K · 2026-10-29 · 2.02 Results of Operations and Financial Condition; 7.01 Regulation FD Disclosure; 9.01 Financial Statements and Exhibits
- 8-K · 2026-10-26 · 1.01 Entry into a Material Definitive Agreement; 1.02 Termination of a Material Definitive Agreement; 2.03 Creation of a Direct Financial Obligation; 9.01 Financial Statements and Exhibits
- 10-Q · 2026-07-23
- 8-K · 2026-07-23 · 2.02 Results of Operations and Financial Condition; 7.01 Regulation FD Disclosure; 9.01 Financial Statements and Exhibits
- 8-K · 2026-07-14 · 1.01 Entry into a Material Definitive Agreement; 9.01 Financial Statements and Exhibits
Measured, not prophesiedSuccess tools: score it, compare it, see its fieldFour questions. Scored against the SEC filings of the companies in your field.
Each benchmark is the median of SEC filers in your industry code, from their own audited filings, read on the filing boards. Reporting, not investment advice.
Figures are as filed in audited 10-K reports and can move with restatements, acquisitions, disposals or a change in fiscal year. A range set from how past company-years turned out is not a promise about the next one, and says nothing about the share price. Reporting, not investment advice. No price targets and no trading recommendations. Figures from the SEC’s own data · every filing · this page as JSON · Open in Excel (CSV) · Ten-year table (CSV) ·